 #YousefThings
Design your organization, see the impact before you commit.
Tafany turns your data into a living org model — restructure visually, plan the workforce, and price the pay, quantifying the cost, span and risk of every change before you commit.
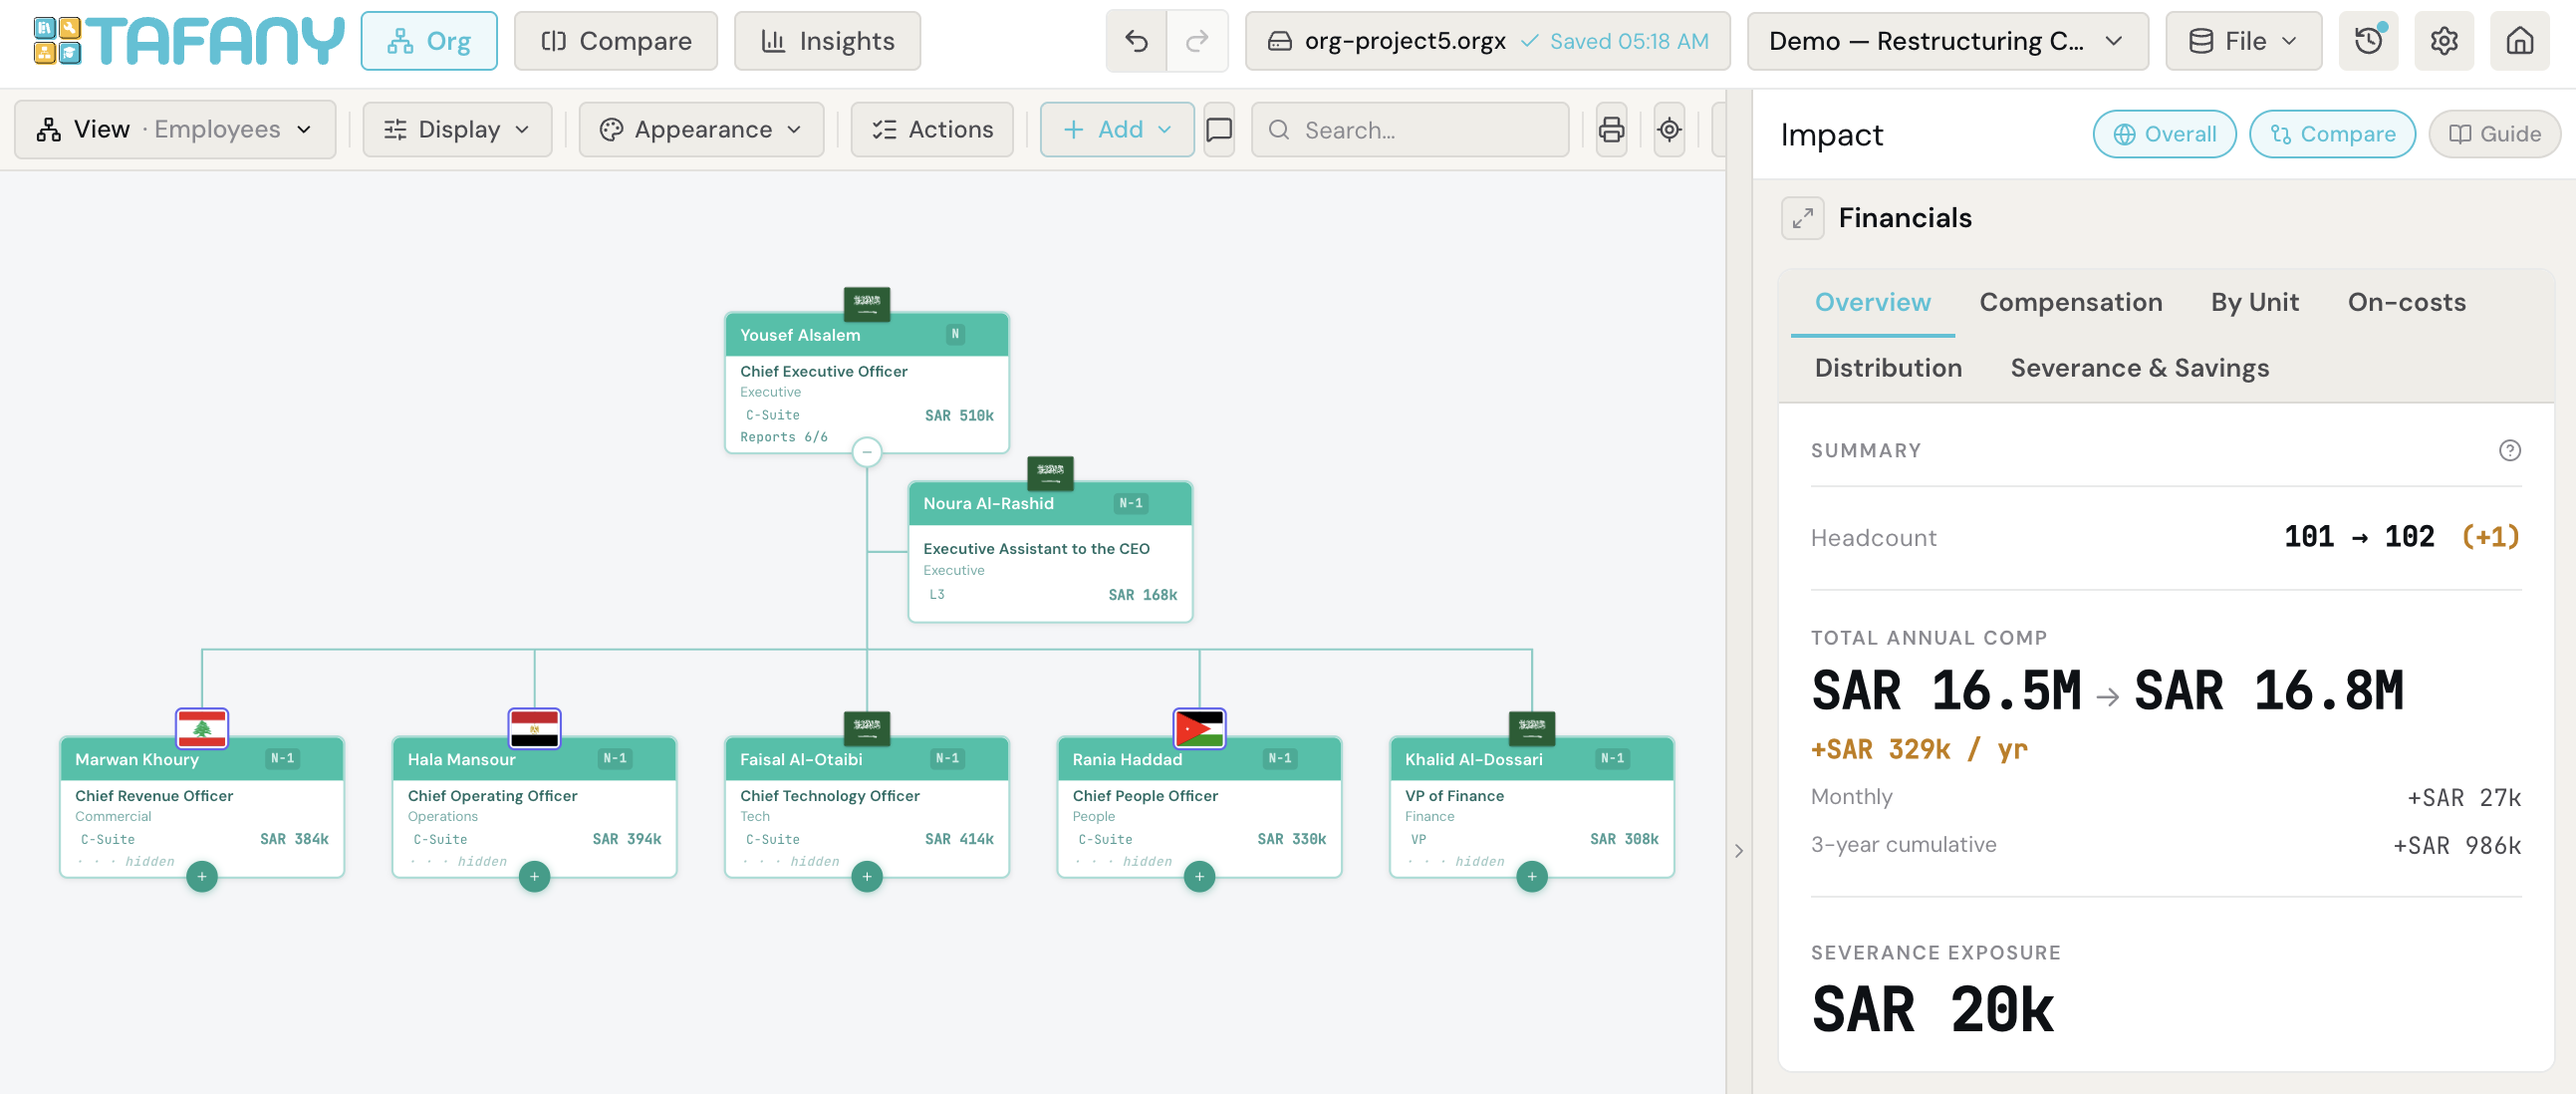
Restructure on a live canvas — every move re-prices the org in real time.
Restructure visually
Drag, re-parent, split, merge and eliminate roles across Employee, Business-Unit, Division, Department and Org-Unit views.
Scenarios & compare
Model alternative designs and compare them side by side on cost, on-costs, org-health, depth and diversity.
Insights dashboard
Build your own board — span of control, layer depth, cost breakdowns, pyramids, sunburst and an Org-design tab, all drag-resize-reorder across your tabs.
Design review & scorecard
Score the structure on eight design dimensions, get an organization complexity index, and run rule checks that flag wide spans, deep layers and sub-scale teams — each explained in plain language.
Financials & on-costs
Salary plus HR on-costs, severance and a phased-savings break-even timeline for every change you model.
People analytics
Demographics, nationality flags, gender & expat mix, pay-gap, succession coverage and key-person risk.
Work together, lose nothing
Teams share cloud projects: everyone can edit, simultaneous saves merge automatically, and teammates’ changes appear on your screen within seconds — never overwritten, never lost. Per-person access groups decide who sees compensation: salary data is withheld at the server, not just hidden. Plus comments, dotted reporting lines and a time-stamped activity log.
Shapes & annotations
Frame teams with rectangles, ellipses, lines, arrows, text and business emojis — colour, rotate and resize them to mark up the canvas.
Import & export
Bring your org in from Excel, save the whole project to a local .tafany file, and export the chart to PDF or the data to CSV.
Compensation suite
Design pay bands, run a merit matrix, benchmark against the market, check pay equity, and model EOSB & Saudization — GCC-ready, built in.
Workforce planning
Driver-based demand, a headcount-plan matrix, month-phased budgets, vacancy economics and a flight-risk model that skews attrition to the risky units.
Org units — structure first
Declare business units, divisions and departments that exist before anyone is hired into them — design the shape now, fill the seats later. Import structure-only from Excel.
A glimpse of the insights
Live charts on sample data — hover to explore.
Everything you need to redesign an org
How it works
Load your org
Import an Excel file or start with the sample / a blank canvas.
Model the change
Move people, eliminate roles, add hires — across multiple scenarios.
Quantify & share
Compare scenarios and read the Insights dashboard, then export the chart, the data or a board-ready memo.
Ready to redesign your organization?
Import your data, model the change, and see the cost & impact — all in your browser, saved locally or to your private cloud.